

Digital Receipt Insights
Transforming raw receipt data into actionable business intelligence
Led end-to-end design of a platform that helps merchants uncover insights, reduce manual work, and make faster decisions.

Lead Product Designer

UX, Strategy, Research

6 months

Reduced manual analysis

Improved data visibility

Simplified complex data

Faster decision-making

The Problem
Merchants generate large amounts of receipt data—but struggle to use it.

Data is fragmented
Insights require manual effort
Decisions are delayed
The issue wasn’t lack of data—it was lack of usable insight.
Opportunity
Reframing receipts from static records into a lightweight analytics tool unlocks faster, smarter business decisions.
My Role

Led product vision and UX strategy

Conducted research and defined insights

Designed end-to-end experience

Collaborated with product & engineering
Key Insights → Product Strategy

Users want answers,not raw data

Simplify
Turn complex data into digestible summaries


Speed matters morethan depth

Surface
Highlight meaningful patterns automatically

Too much datacreates friction

Enable
Make insights actionable
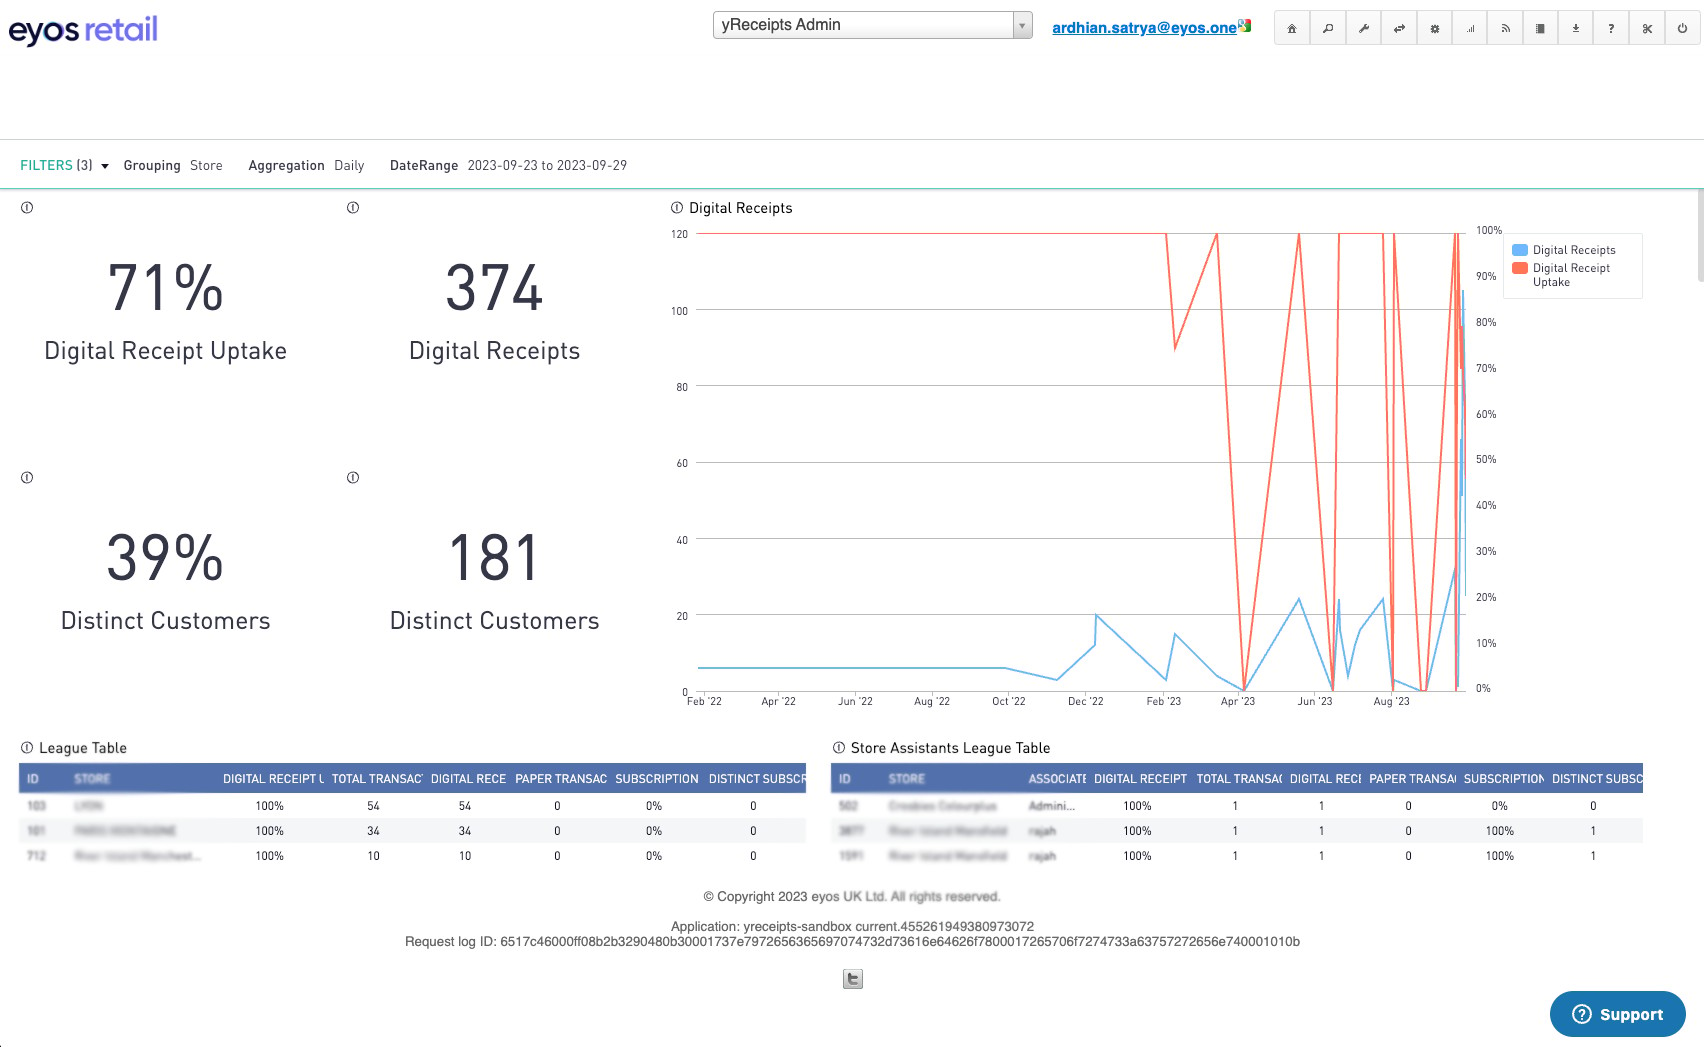
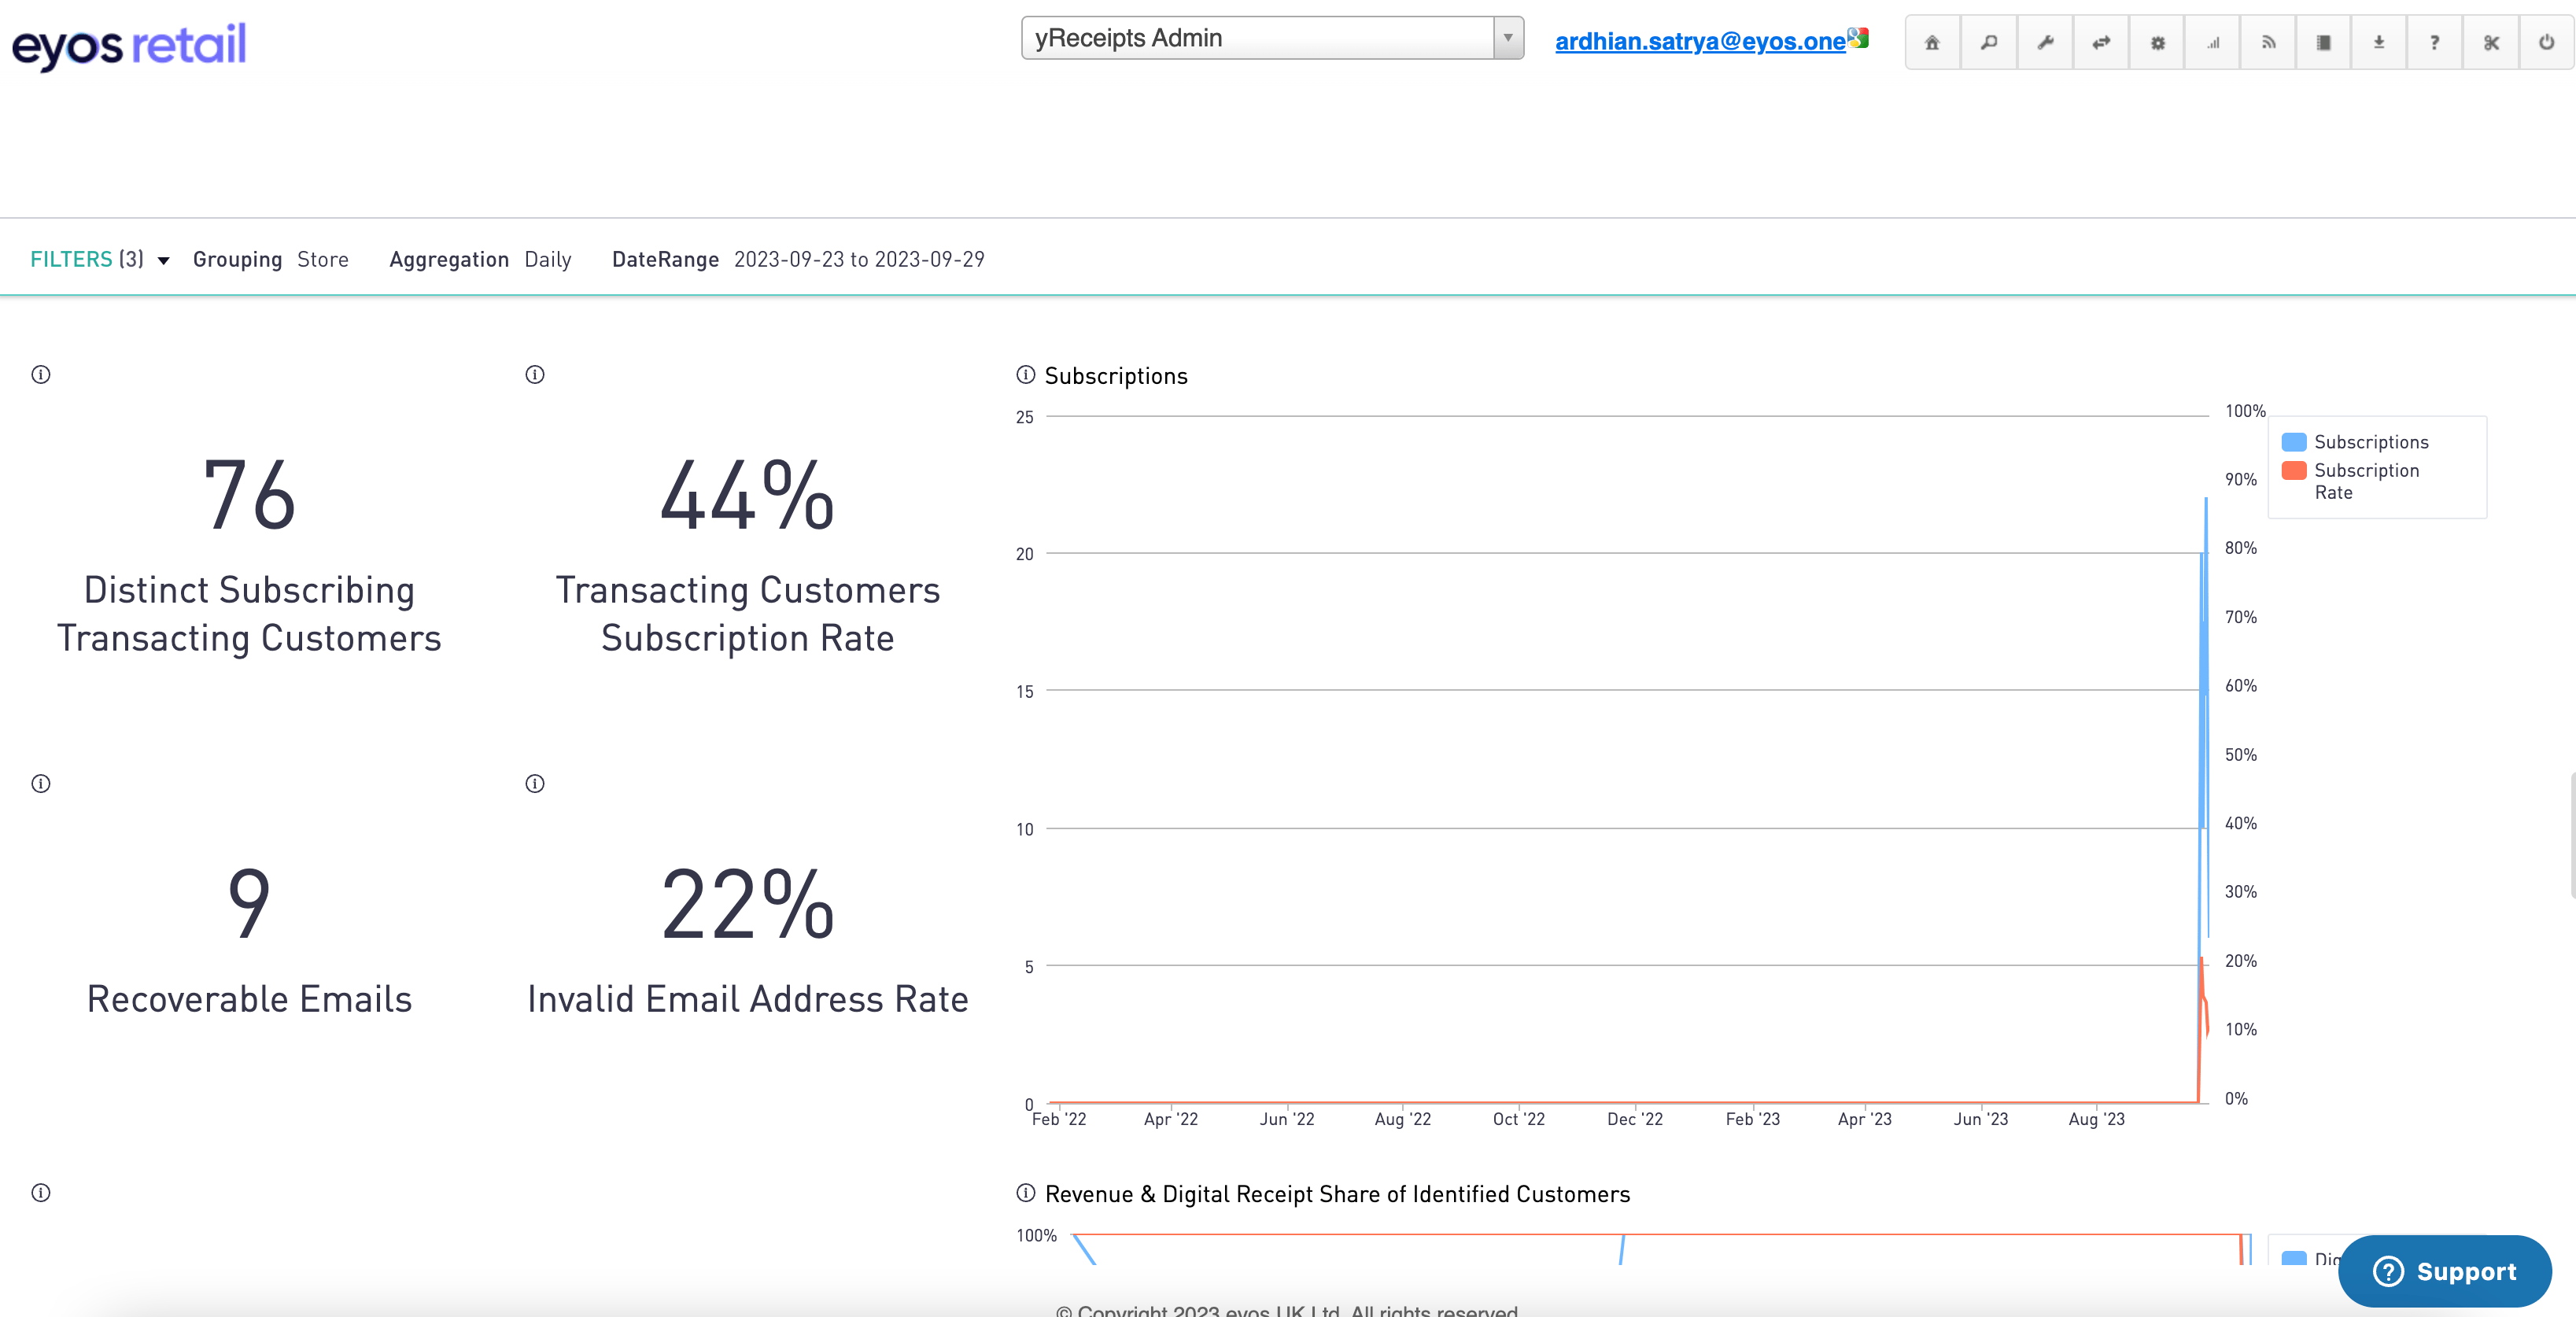
Old dashboard audit
There were 3 important areas that need to be improved:
1
One main issue with the old dashboard was the report's single-page format, which contained numerous blocks that overburdened the user's cognitive capacity.
2
The content lacked clear organisation and hierarchy, making it difficult for users to discern the most important information.
3
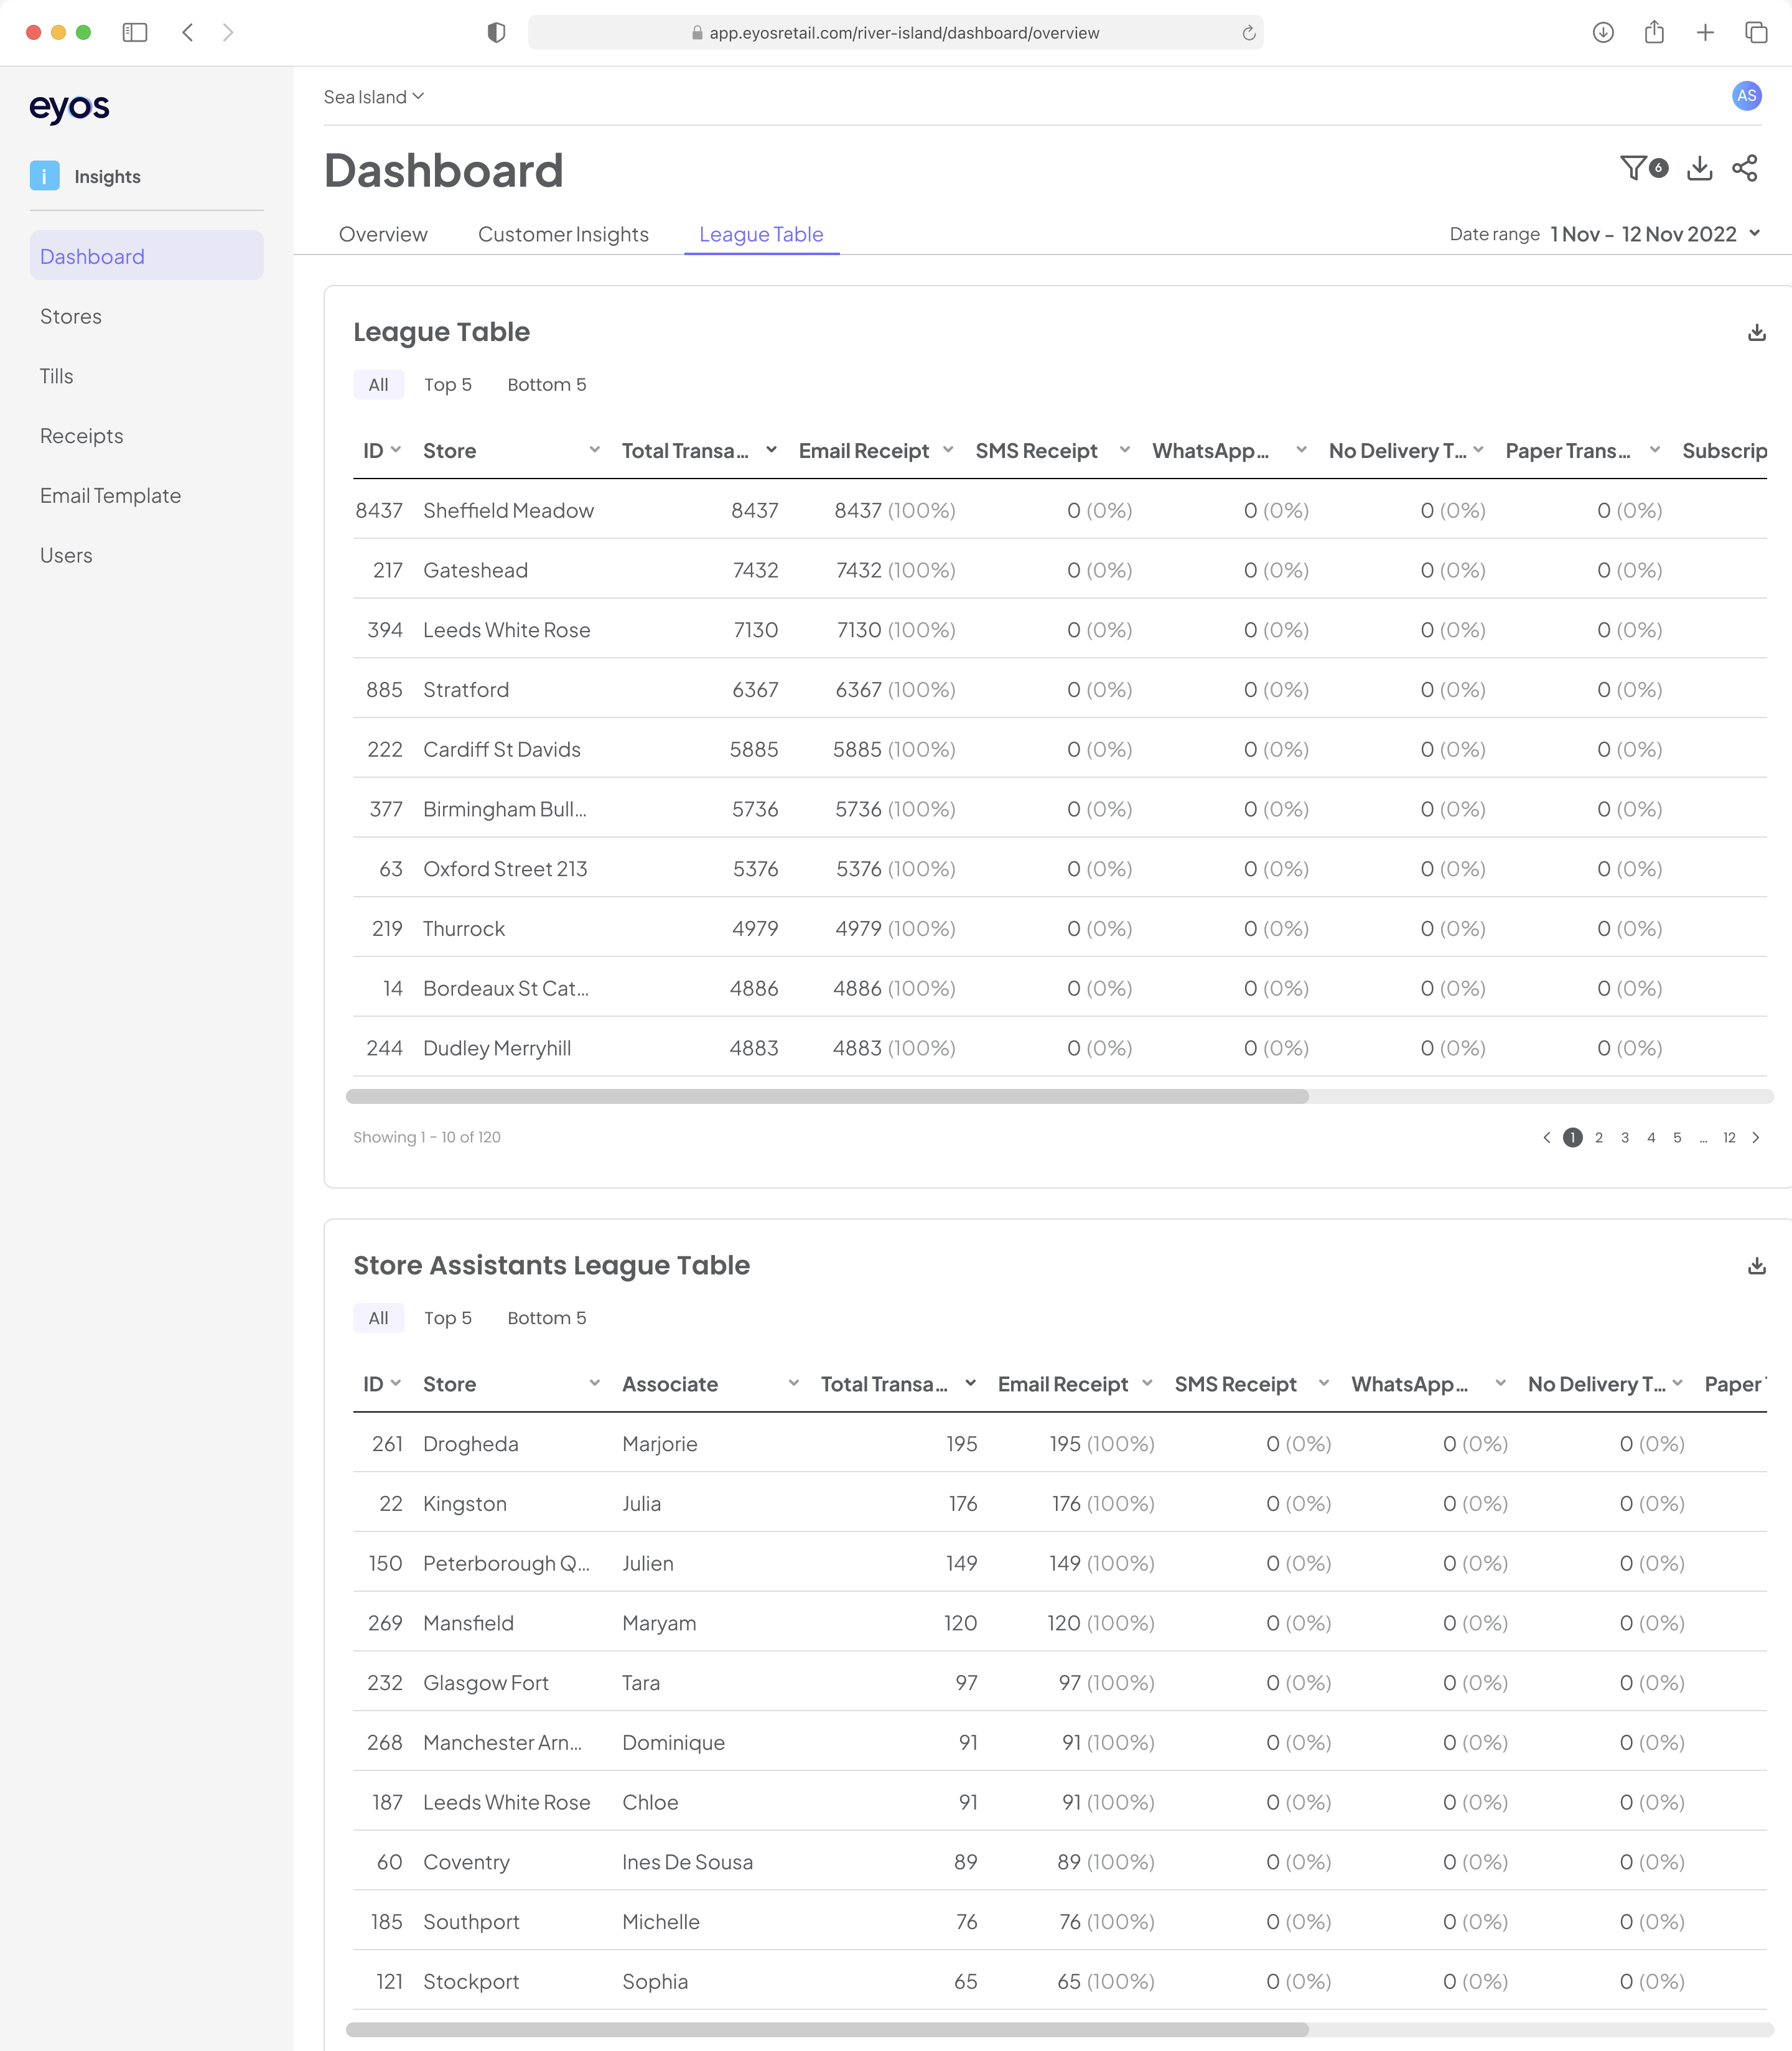
The report only included data from email digital receipts, failing to consider other delivery methods like SMS and WhatsApp that were launched at a later date.
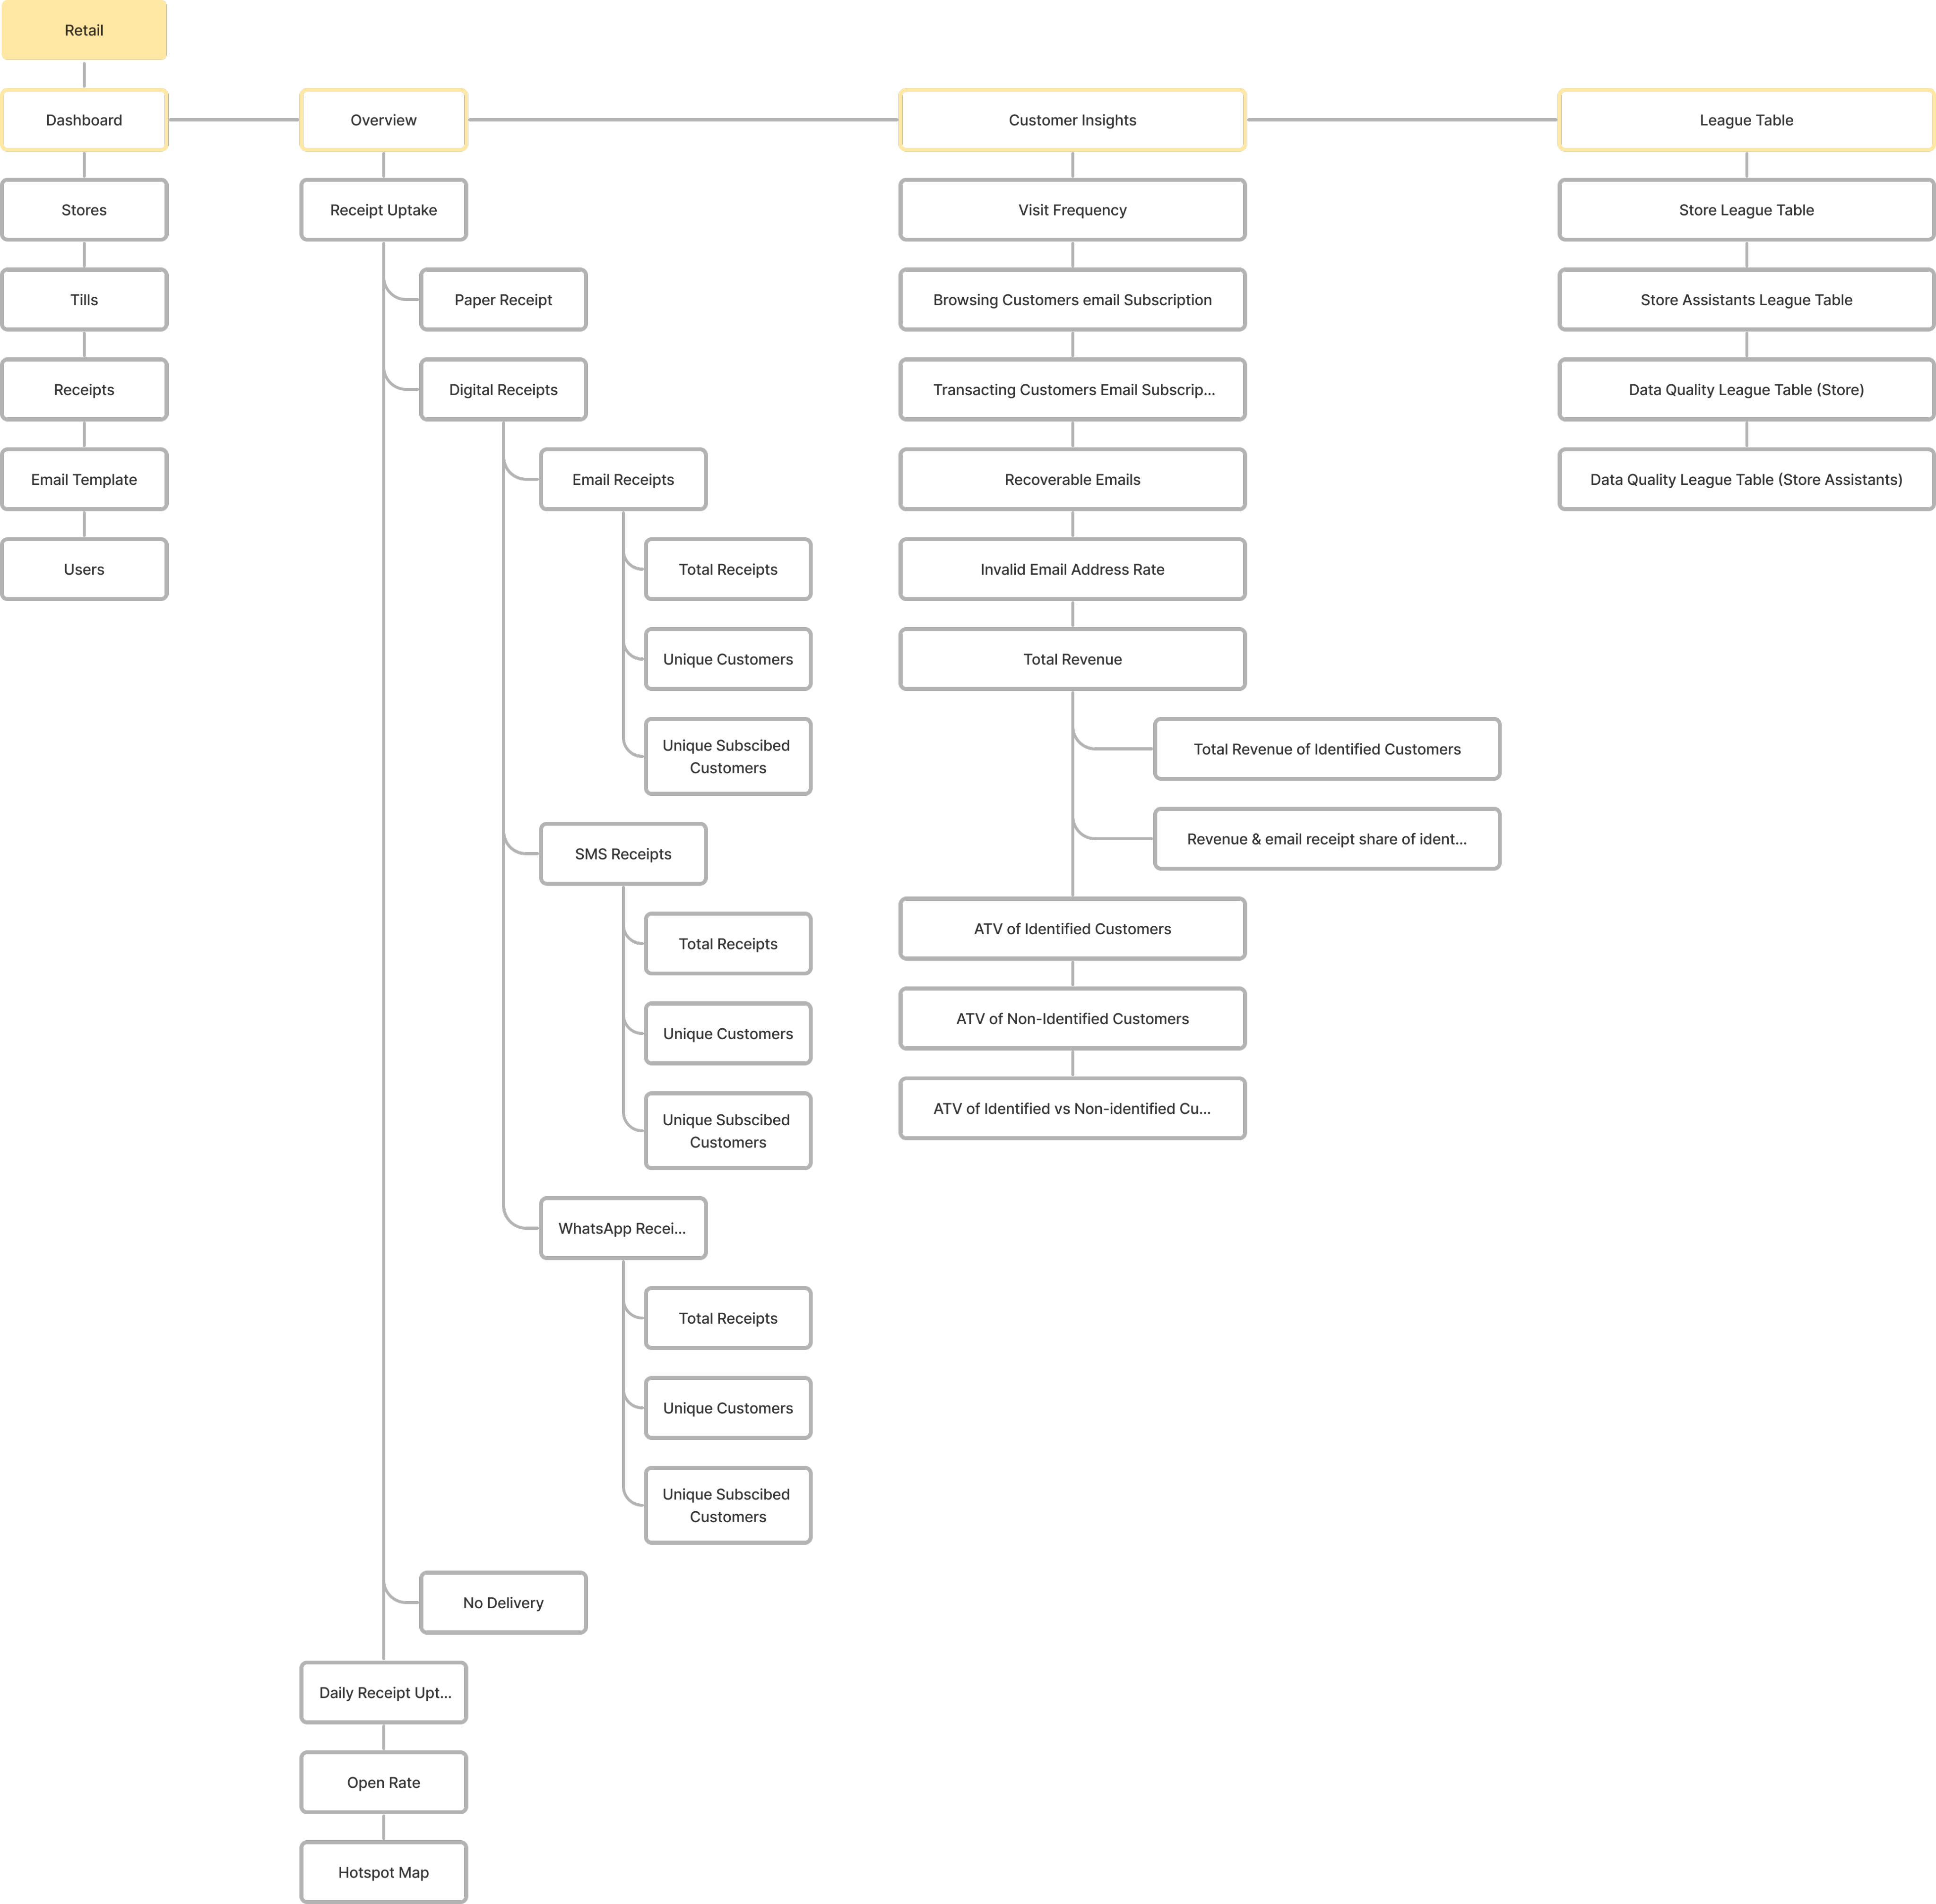
Redefining the Information Architecture
We started by rebuilding the IA from ground up to make sure that complex insights are broken down into smaller nuggets so it won’t confuse the user.
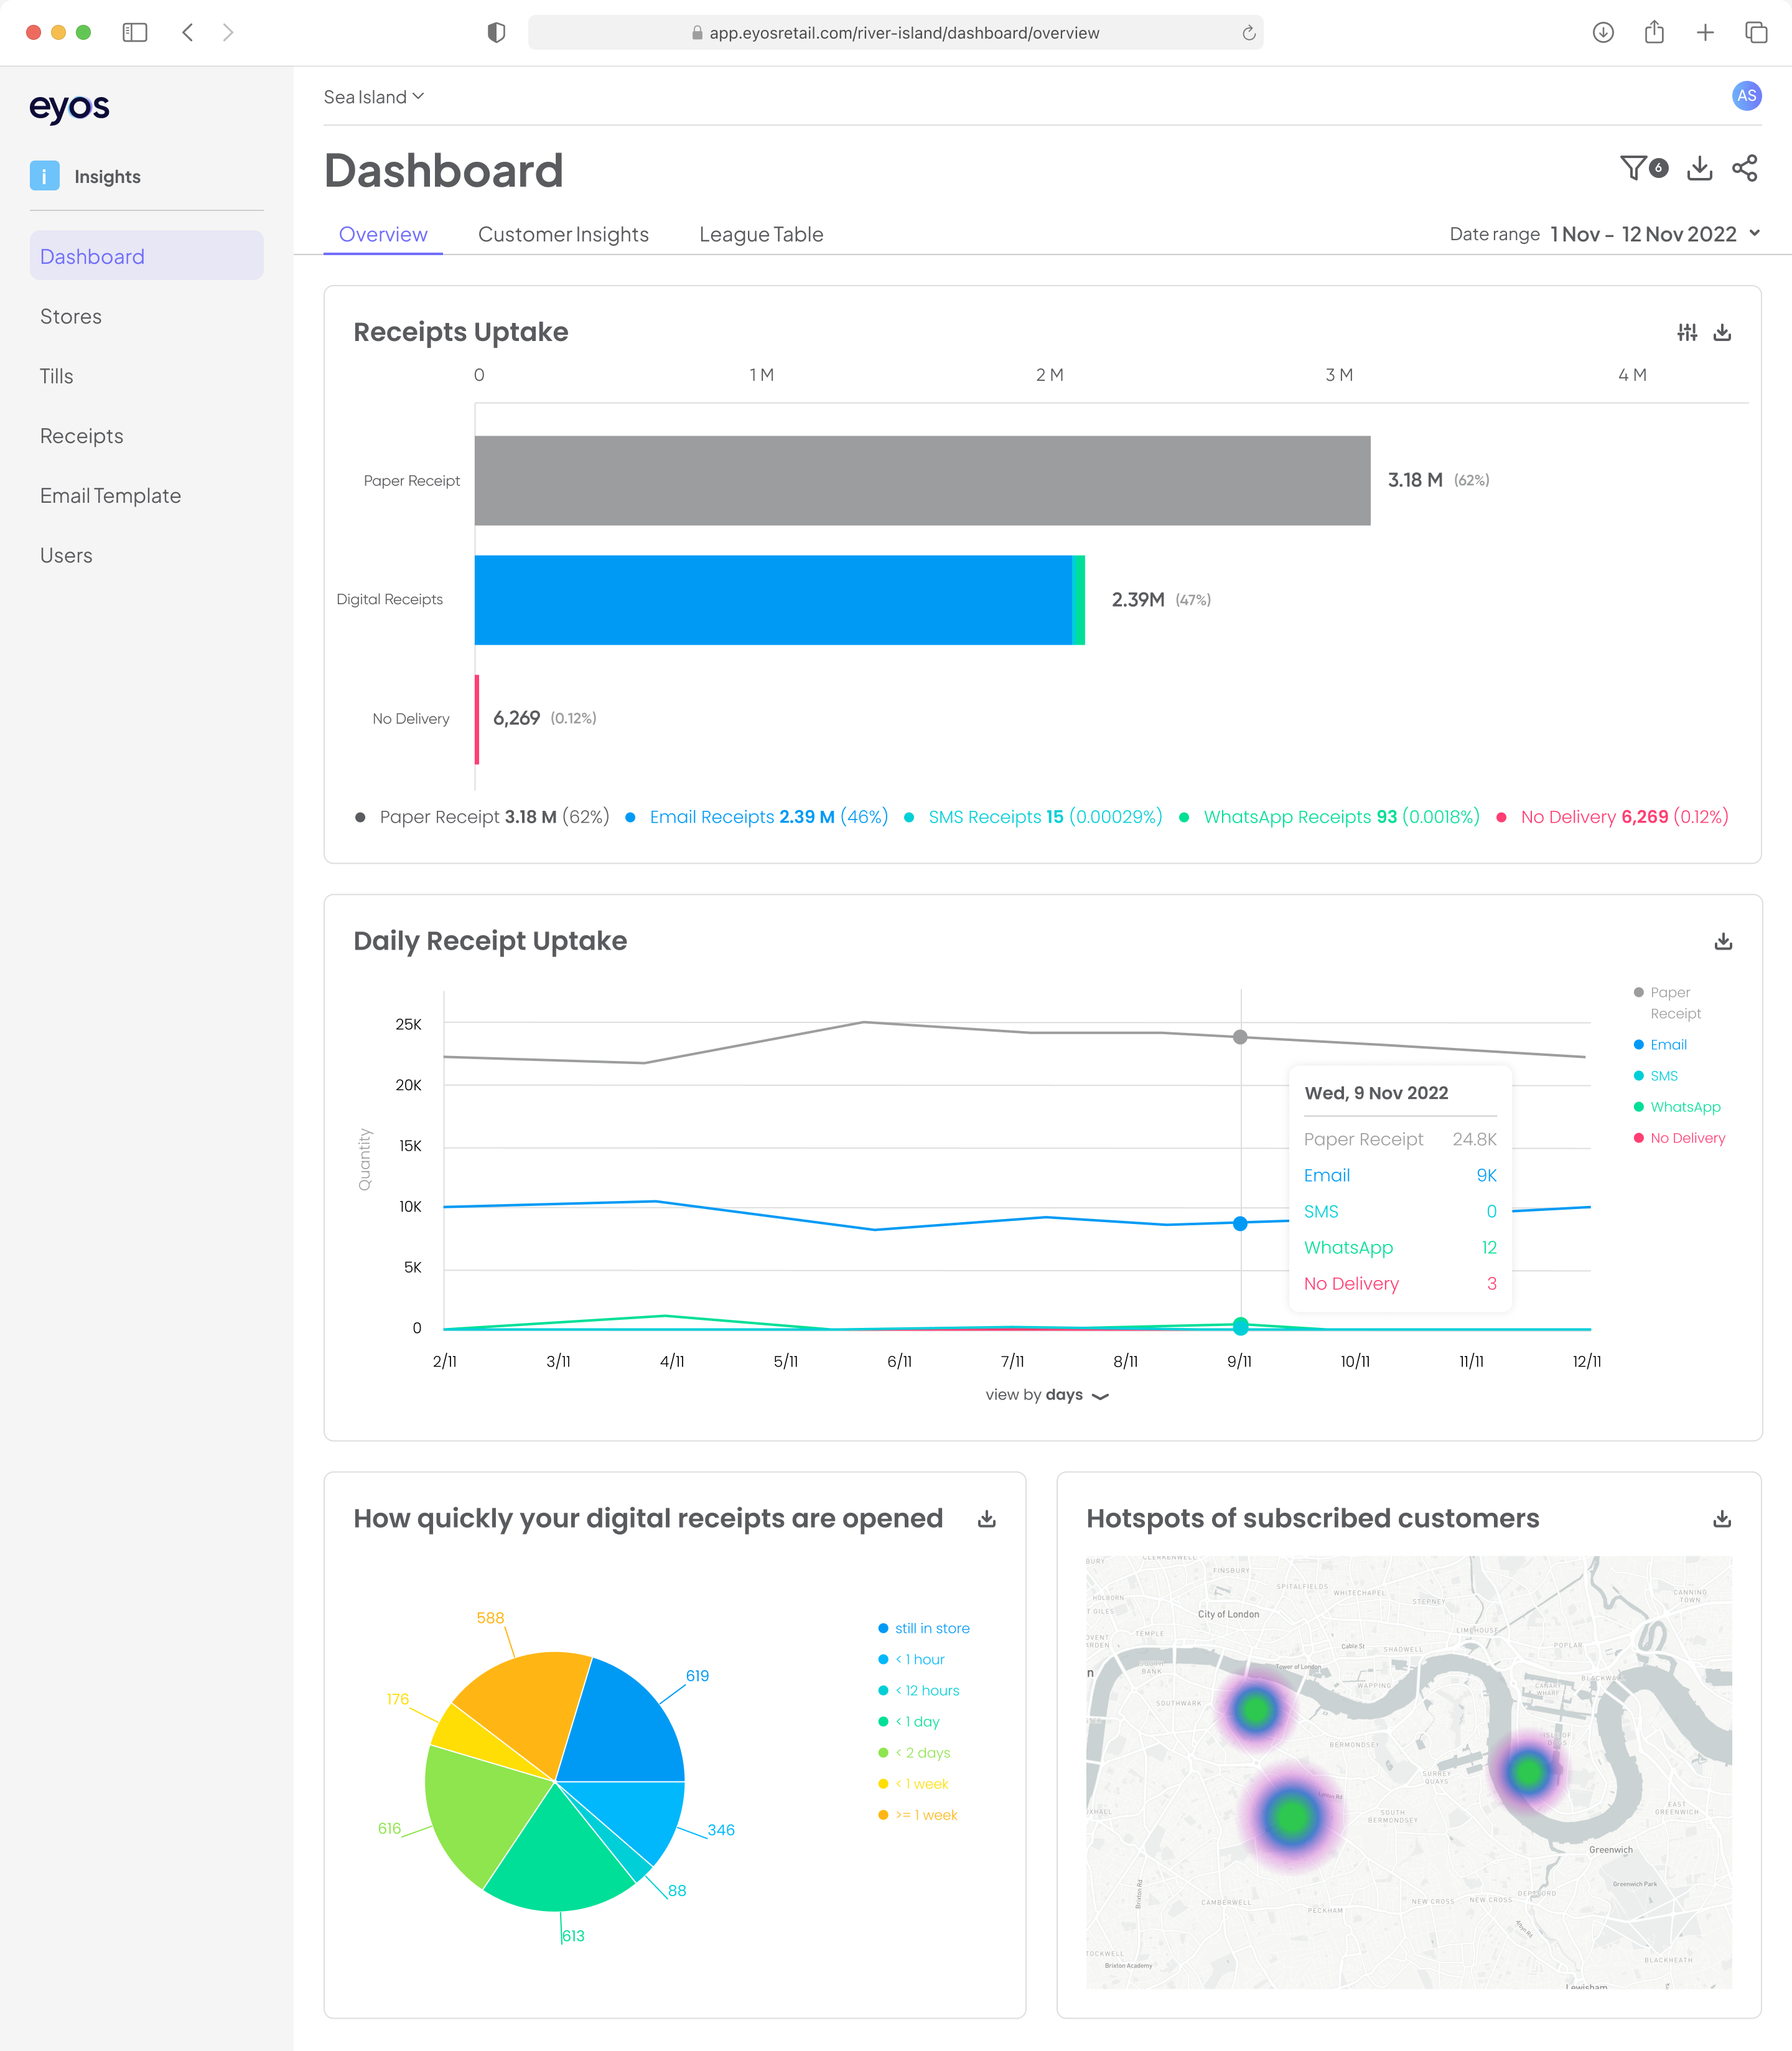
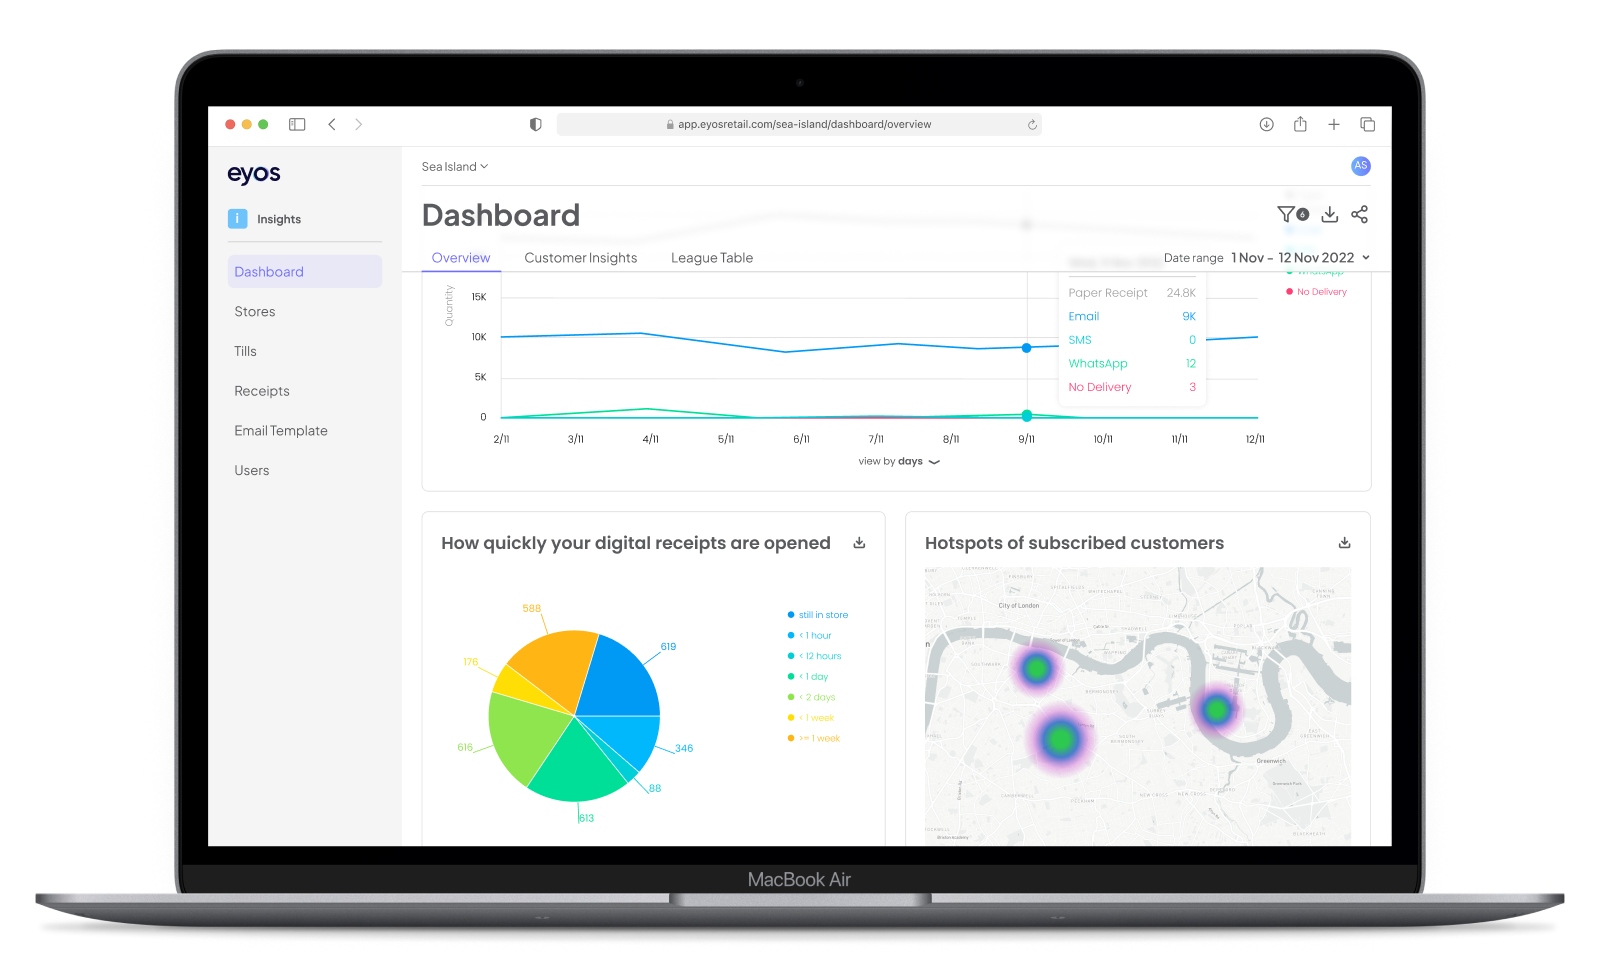
Solution
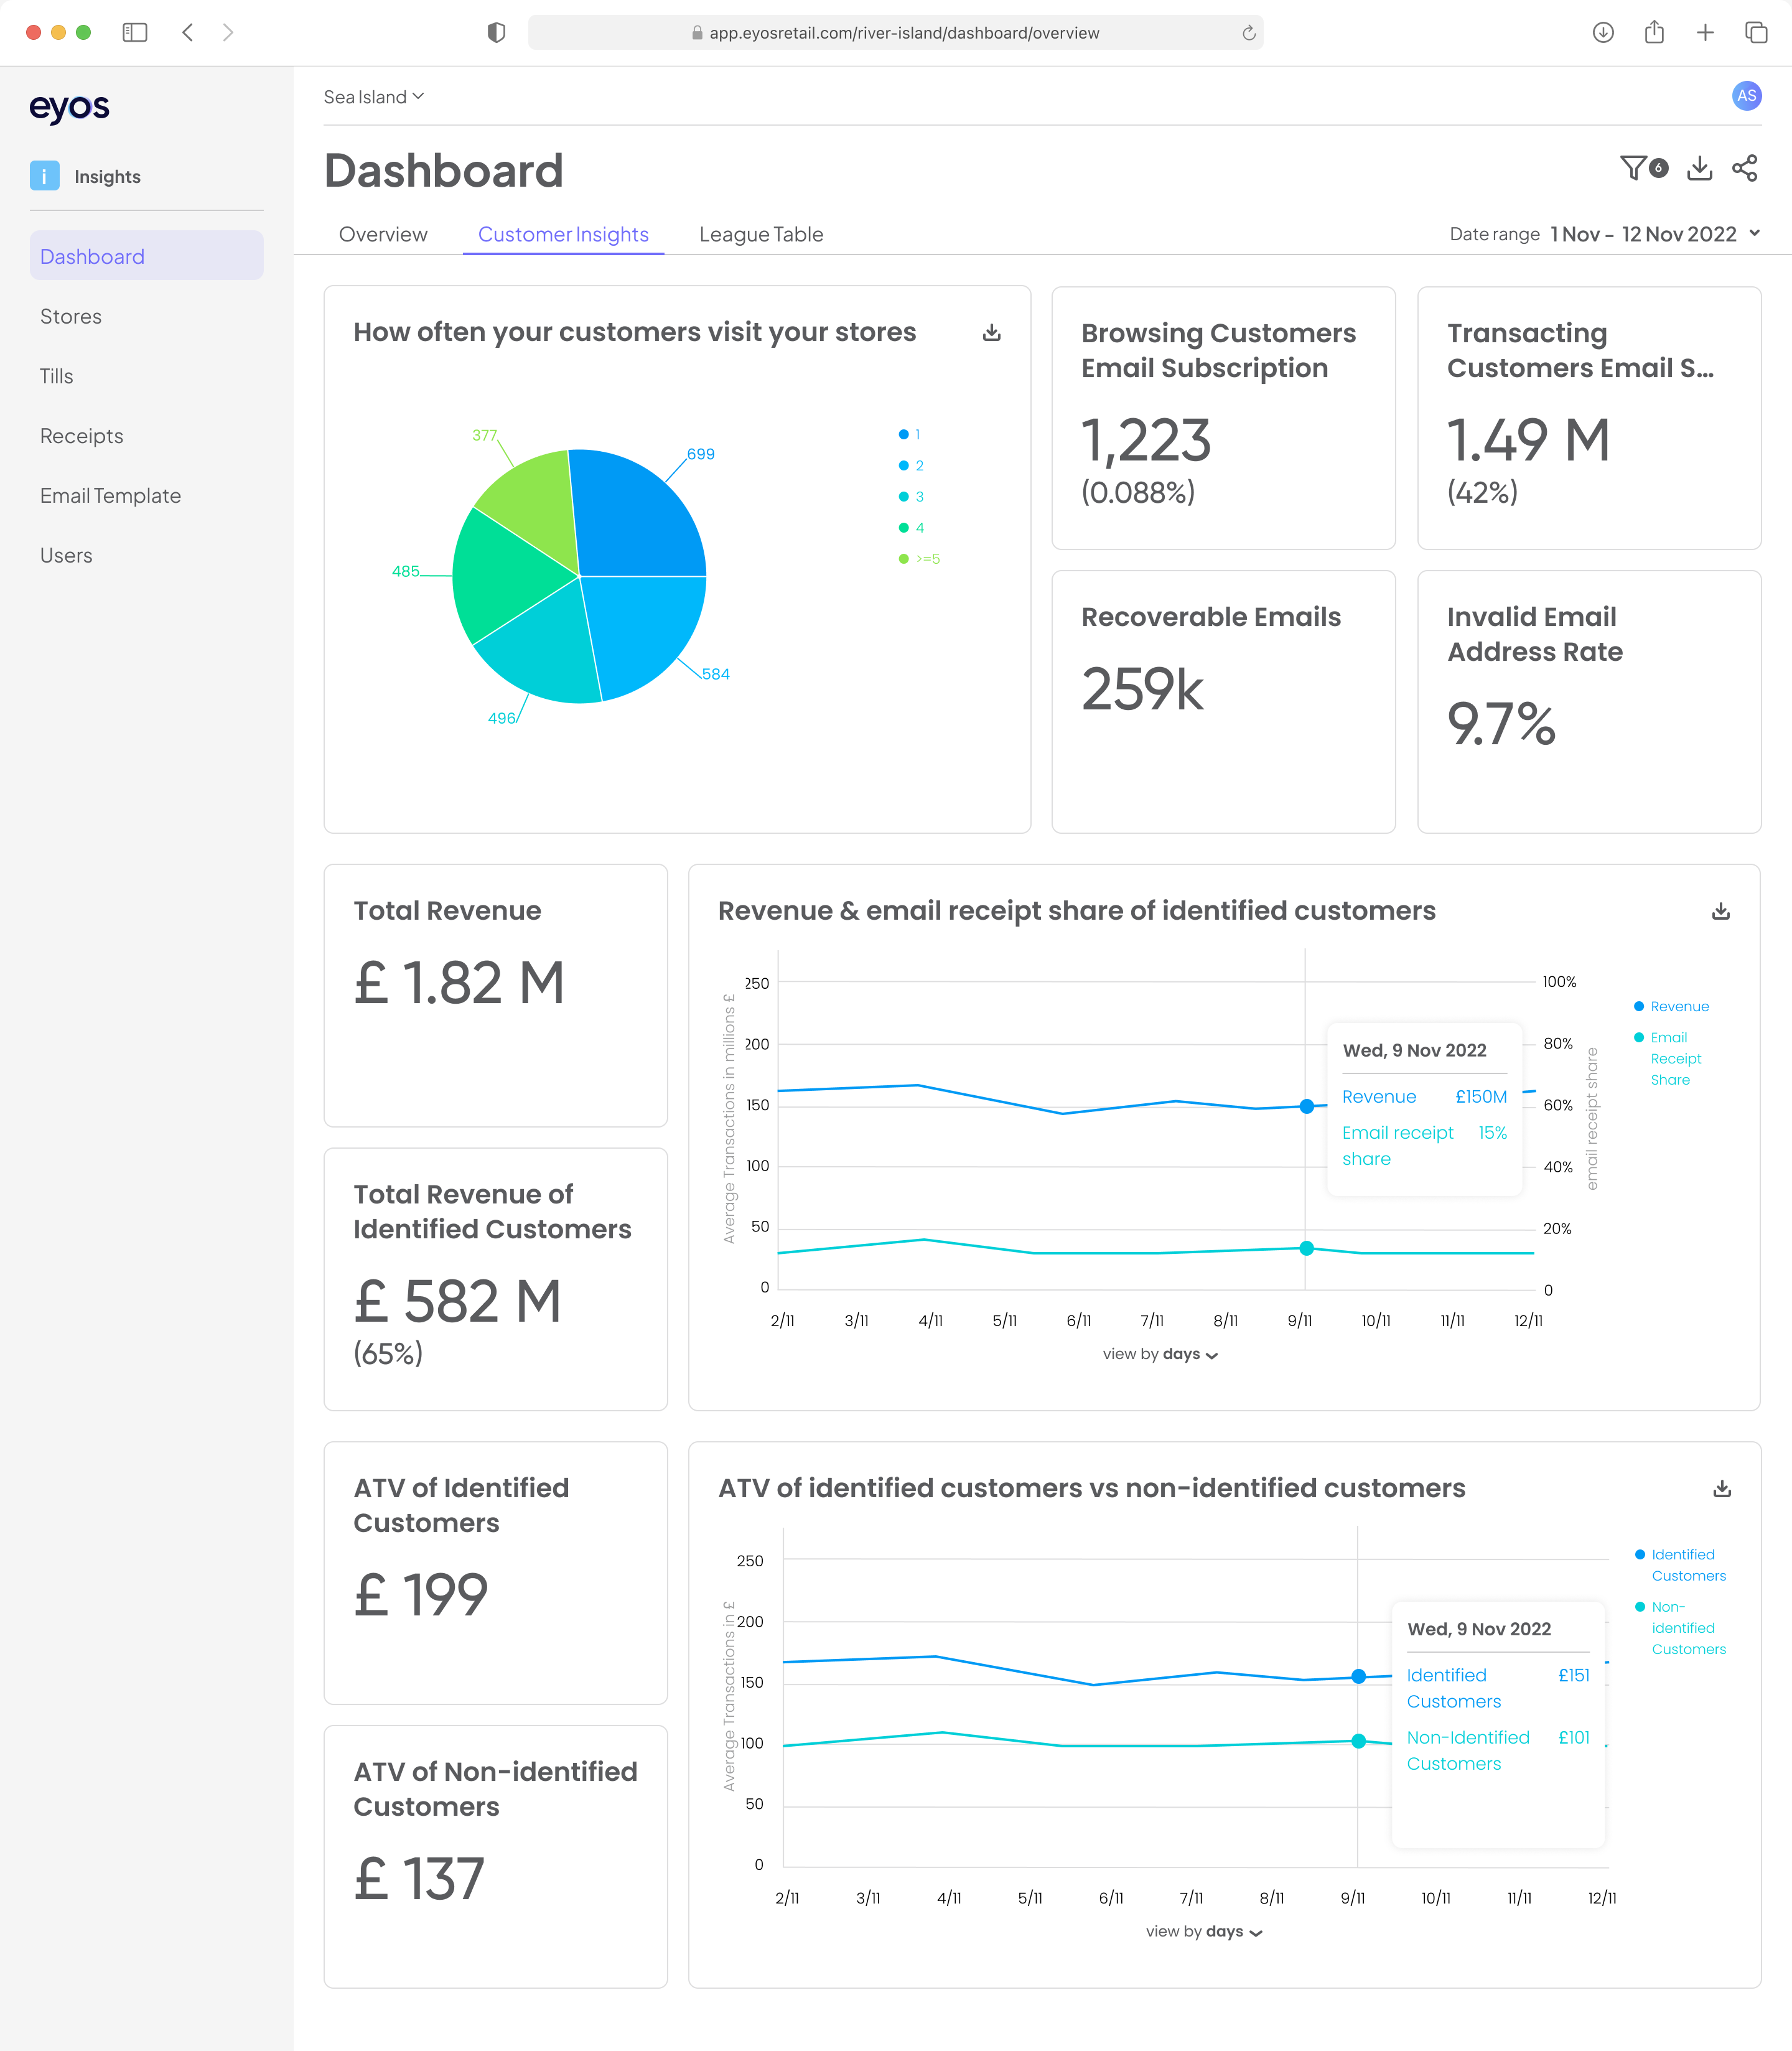
A platform that transforms receipt data into structured insights.

Quick Summary View

Trend Visualization

Data Breakdown
Key features & impacts

Data Structuring
Transforms raw receipt inputs into clean datasets

Enables accurate analysis
Insight Dashboard
Surfaces trendsand patterns
Faster decision-making
Visual Summaries
Replaces tables with intuitive visuals
Reduces cognitive load
Reflection
What worked
- Clear strategy alignment
- Strong usability focus

What I’d improve
- Validate earlier with real users
- Explore deeper integrations
- Add advanced features progressively

Great products don’t just organise data—they enable better decisions.


Digital Receipt Insights
Transforming raw receipt data into actionable business intelligence
Led end-to-end design of a platform that helps merchants uncover insights, reduce manual work, and make faster decisions.
Lead Product Designer
UX, Strategy, Research
6 months
Reduced manual analysis
Improved data visibility
Simplified complex data
Faster decision-making

The Problem
Merchants generate large amounts of receipt data—but struggle to use it.
Data is fragmented
Insights require manual effort
Decisions are delayed
The issue wasn’t lack of data—it was lack of usable insight.
Opportunity
Reframing receipts from static records into a lightweight analytics tool unlocks faster, smarter business decisions.
My Role
Led product vision and UX strategy
Conducted research and defined insights
Designed end-to-end experience
Collaborated with product & engineering
Key Insights → Product Strategy
Users want answers,not raw data
Simplify
Turn complex data into digestible summaries
Speed matters morethan depth
Surface
Highlight meaningful patterns automatically
Too much datacreates friction
Enable
Make insights actionable
Old dashboard audit
There were 3 important areas that need to be improved:
1
One main issue with the old dashboard was the report's single-page format, which contained numerous blocks that overburdened the user's cognitive capacity.
2
The content lacked clear organisation and hierarchy, making it difficult for users to discern the most important information.
3
The report only included data from email digital receipts, failing to consider other delivery methods like SMS and WhatsApp that were launched at a later date.
Redefining the Information Architecture
We started by rebuilding the IA from ground up to make sure that complex insights are broken down into smaller nuggets so it won’t confuse the user.
Solution
A platform that transforms receipt data into structured insights.
Quick Summary View
Trend Visualization
Data Breakdown
Key features & impacts
Data Structuring
Transforms raw receipt inputs into clean datasets
Enables accurate analysis
Insight Dashboard
Surfaces trendsand patterns
Faster decision-making
Visual Summaries
Replaces tables with intuitive visuals
Reduces cognitive load
Reflection
What worked
- Clear strategy alignment
- Strong usability focus
What I’d improve
- Validate earlier with real users
- Explore deeper integrations
- Add advanced features progressively
Great products don’t just organise data—they enable better decisions.